
numpy 2-D Array Axis Ordering & meshgrid Behavior
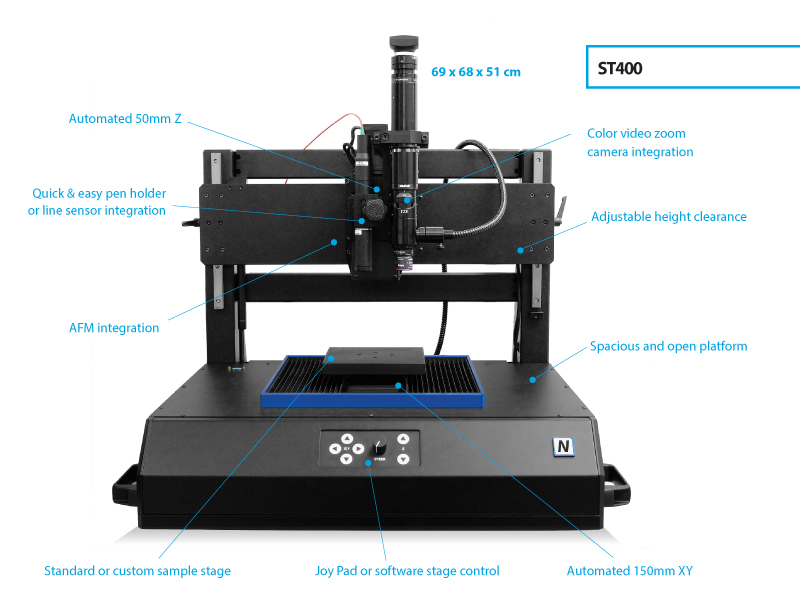
[ ]I’ve been working lately with data generated from an optical profilometer (this one), which consists of an array of \(z\) values mapped across a 2-D grid in \(x\) and \(y\). I’m needing to manipulate it in various ways in Python—plotting, leveling, fitting, etc.—and many of these operations require the underlying grid to be explicitly specified. numpy.meshgrid is a handy function for this, but its axis ordering assumptions have been somewhat awkward to keep straight.
The axes of numpy arrays are identified by integer indices; for a 2-D array, thus, there is axis=0 and axis=1. numpy’s intrinsic behavior is for indexing along axis=0 to refer to the row number in the array, and for indexing along axis=1 to refer to the column number. Thus, in arr[i0, i1], the indices i0 and i1 are specifing the element position along axis=0 (how many rows down) and axis=1 (how many columns across), respectively. This is nicely intuitive in the context of linear algebra, as in the array element \(A_{ij}\) the first index, \(i\), refers to the row number of the element, and the second, \(j\), to the column number.
Where problems have typically started to arise for me is when contemplating plotting data that’s mapped across such a 2-D array. Which axis should correspond to the \(x\)-axis of the plot? On one hand, since 2-D data is usually plotted as \(\left(x,y\right)\), one might think that axis=0 would correspond to \(x\). On the other hand, since \(x\) is usually plotted along the horizontal axis (i.e., as the column number changes along a grid), it might make more sense to identify axis=1 as the \(x\)-axis.
My inclination has always been to keep to the former convention, as it’s more natural for me to associate the first index to the array with the \(x\)-axis. It turns out, though, that in certain cases numpy takes the latter convention by default. Where this has historically confused me most significantly is in the use of the meshgrid function. Consider the following:
>>> import numpy as np
>>> a = np.arange(6).reshape((3,2))
>>> a
array([[0, 1],
       [2, 3],
       [4, 5]])
>>> a.shape
(3, 2)
>>> x, y = np.meshgrid(*map(np.arange, a.shape))
>>> x
array([[0, 1, 2],
       [0, 1, 2]])
>>> x.shape
(2, 3)
>>> y
array([[0, 0, 0],
       [1, 1, 1]])
>>> y.shape
(2, 3)
Thus, the default meshgrid behavior is to produce mesh arrays whose shapes and axis associations are transposed with respect to that of the input array. This behavior corresponds to the default value of the indexing argument to meshgrid, 'xy', which indicates to map the first \((x)\) axis of the input along the rows of the output matrices. I’ve just recently found the indexing='ij' mode, which yields meshing matrices that are much more intuitive, for me at least:
>>> x, y = np.meshgrid(*map(np.arange, a.shape), indexing='ij')
>>> x
array([[0, 0],
       [1, 1],
       [2, 2]])
>>> y
array([[0, 1],
       [0, 1],
       [0, 1]])
The shapes match, and the \(x\)-values advance along axis=0.
Time to trawl back through all my various profilometry analysis code and clean up this confusion….